The Chestermere Market Stats for March 2016 include information on how many properties were listed, how many sold, how many were terminated, expired or withdrawn.
The average sale price for the first quarter in Chestermere was $484,029, the average days on market were 62 days. The average list price in Chestermere right now is $639,000. Homes below $500,000 are selling well considering the market we are in. In the past 3 months 52 homes were sold. 70 listings came off of the market, and there are currently 182 homes for sale in Chestermere.
The Market Absorption stats show how long it would take for the market to absorb all of the homes that are currently listed with the current rate of sales. There is no question, it is taking longer for homes to sell, and the more expensive the home the longer it will take to sell. The difference in the average sale price and the average list price shows that more people are looking In the lower price ranges.
It is a good time to move up and buy a better home as the moderately priced homes are selling much better than the estate homes. Call us if you would like our help making this move!
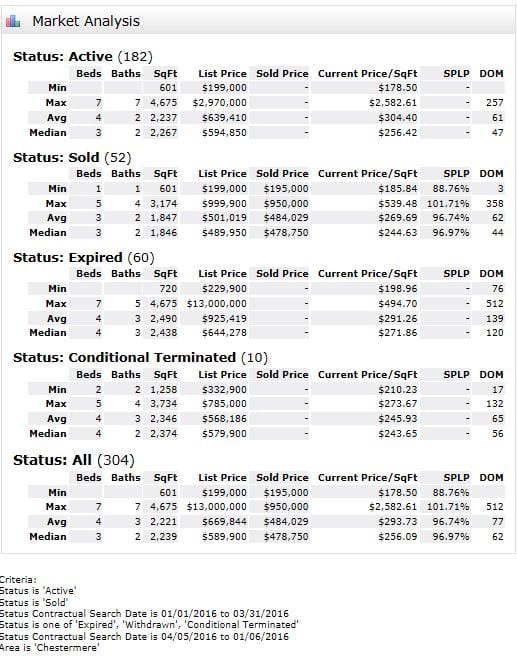
Chestermere real estate statistics for Marh 2016
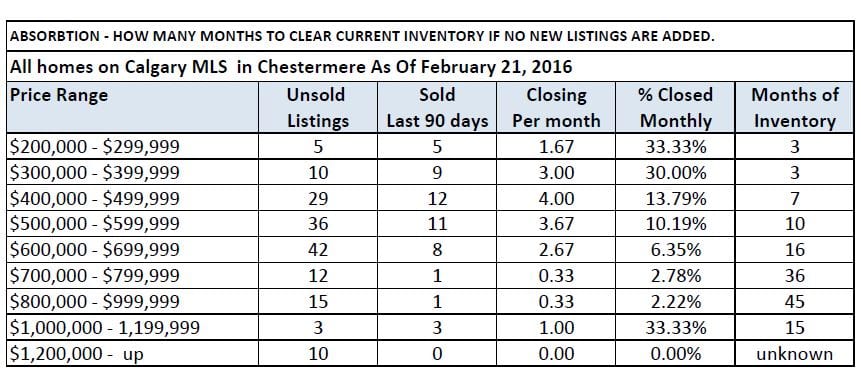
Chestermere Absorbtion rates March 2016