
.
See the Chestermere Market Stats Report for March 2021 here.
Chestermere Market Stats March 2016
By Marjorie and Doug McKay on Tuesday, April 5th, 2016 in Chestermere living, Info Articles, News. No Comments
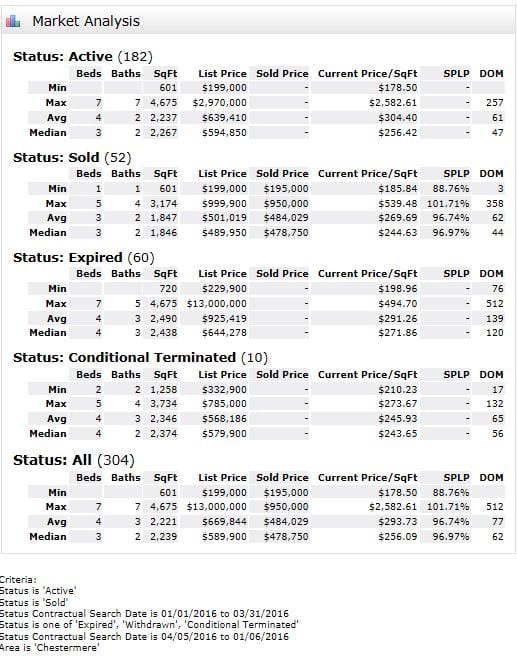
The Chestermere Market Stats for March 2016 include information on how many properties were listed, how many sold, how many were terminated, expired or withdrawn.
The average sale price for the first quarter in Chestermere was $484,029, the average days on market were 62 days. The average list price in Chestermere right now is $639,000. Homes below $500,000 are selling well considering the market we are in. In the past 3 months 52 homes were sold. 70 listings came off of the market, and there are currently 182 homes for sale in Chestermere.
The Market Absorption stats show how long it would take for the market to absorb all of the homes that are currently listed with the current rate of sales. There is no question, it is taking longer for homes to sell, and the more expensive the home the longer it will take to sell. The difference in the average sale price and the average list price shows that more people are looking In the lower price ranges.
It is a good time to move up and buy a better home as the moderately priced homes are selling much better than the estate homes. Call us if you would like our help making this move!
Chestermere real estate statistics for Marh 2016
Chestermere Absorbtion rates March 2016
These are the early numbers for February 2016 for market absorption by price range. This is the amount of time it will take all of the homes to sell if no further homes are added to the inventory at current rate of sale. We are finding the market is picking up, however more new listings are also coming in.

How long will it take my home to sell.
December 2, 2015
Here is a look a the sales in Chestermere November 2015 broken down by price range.
The most active price range was in the $400,000 to $600,000 range,with 60% of the homes selling in this price range. Of 123 home listed 33 sold and an additional 5 were report as under contract at the end of the month. It is a buyer’s market in Chestermere as it is in the Calgary region.

November 15, 2015
The real estate market has slowed down. This chart shows that sales in August, September and October are less than previous months. This is not unusual when there is an election. But it also appears that there are concerns about the economy. For buyers it means that you have more time to decide. However there are still multiple offers within days for the right property.

July to September Absorbtion Rates. October 20, 2015
Market slows down in third quarter. All in all the market in Chestermere is not too bad until you get over the $699k range with an absorbtion rate of many months for over this range. No homes have sold over the $800,000 range in this period as reported on the MLS system. All price ranges are taking longer to sell and the inventory is increasing, which is good news if you are a buyer. Sellers will have to keep their expectations in check, Hopefully now that the election is over the buyers will realize that they still need to buy a home.

June 2015 Market Statistics for Chestermere Area.
When you compare June to May of 2015, we can see an improvement in the absorbtion rate across all price ranges. The hottest price range is the $400,000 range with average days of 39 on market and three months of inventory. Similar to the Calgary region in general the over $1,000,000 range has a lot more homes on the market than are selling. If you are buying in this price range you will have a wide selection of homes available. If you are selling in this range, you will have to be the best home on the market at the best price, and be patient, as the market absorbs the many homes for sale.

May 7, 2015 The Chestermere real estate market is performing well. Inventory levels are healthy right up to the $700,000 range. The provincial election has slowed down the market for the past month, so we are predicting a very busy time right until the summer slow-down in July and August.
It is a great time to upgrade, as interest rates are low, lower priced homes are selling faster than the higher priced homes, giving you an opportunity to negotiate a great deal.
We would love to help. Call Doug, Marjorie or Michelle. 403-207-1776

April 1, 2015
Absorbtion Rates for 2015 First Quarter in Chestermere.
From January 1st to March 31, 1015 58 listings have sold. Currently there are 214 unsold listings on the Calgary Real Estate Boards MLS system. Broken down into price range this chart will show you how many months it will take to sell current inventory if no new homes are added.

Average price per sq. ft. over the past year in Chestermere.


How Long Will It Take My Chestermere Home To Sell? November 2014
The statistics below show how many homes are on the market and how many have sold in the past 90 days. This tells us how long it will take the market to absorb the homes currently listed. Right now it is an excellent time to sell your home under the $600,000 range. In general there is less than 2 months worth of inventory and homes are selling in under 66 days.
It is also an excellent time to upgrade your Chestermere home!
Homes over the $600,000 range in Chestermere have a much longer absorbtion rate and will experience a longer time on the market. Which means that if these people want to move they may be more negotiable on their price.
As your Chestermere real estate office we know the market. Call us if you would like help buying or selling your home.

Chestermere March 2014 Market Statistics
Chestermere single family house prices hit the highest average sale price in March since 2009, according to the Calgary Real Estate Board. The number of sales is up from March 2013 from 24 to 28, and the days on market for march is actually longer at 58 days compared to 37, however for the year to date the days on market is down from 60 to 55. Sellers are able to hold a bit firmer to their price with a .25% difference between list price and sale price.
If you have been putting off a move, now is a great time to sell. Call us we would love to help you.


Chestermere February 2014 Market Statistics.
Good news for Chestermere home owners.
Chestermere average sales prices for single family homes are up 9% from last year according to the Calgary Real Estate board. Sales are up 73% and average days on market are down from 81 to 53. Call us if you would like a free, no hassle home evaluation. We have a marketing program that will help you sell your home for all that it is worth.
See the full statistics package for February 2014 Chestermere here.

Chestermere Market Reports
Chestermere Market Stats March 2016
By Marjorie and Doug McKay on Tuesday, April 5th, 2016 in Chestermere living, Info Articles, News. No Comments
The Chestermere Market Stats for March 2016 include information on how many properties were listed, how many sold, how many were terminated, expired or withdrawn.
The average sale price for the first quarter in Chestermere was $484,029, the average days on market were 62 days. The average list price in Chestermere right now is $639,000. Homes below $500,000 are selling well considering the market we are in. In the past 3 months 52 homes were sold. 70 listings came off of the market, and there are currently 182 homes for sale in Chestermere.
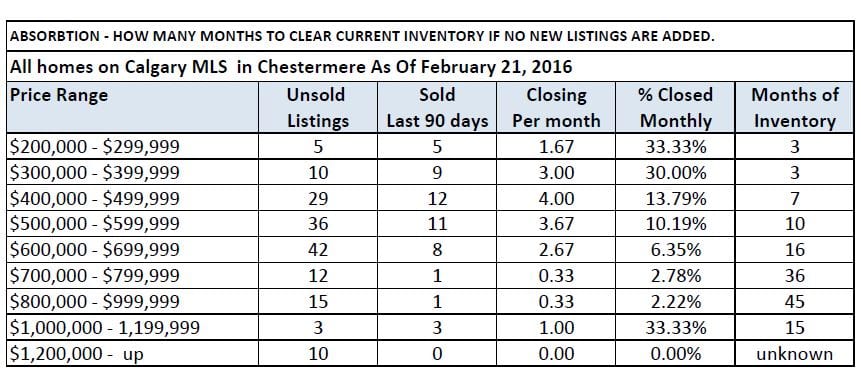
The Market Absorption stats show how long it would take for the market to absorb all of the homes that are currently listed with the current rate of sales. There is no question, it is taking longer for homes to sell, and the more expensive the home the longer it will take to sell. The difference in the average sale price and the average list price shows that more people are looking In the lower price ranges.
It is a good time to move up and buy a better home as the moderately priced homes are selling much better than the estate homes. Call us if you would like our help making this move!
Chestermere real estate statistics for Marh 2016
Chestermere Absorbtion rates March 2016
These are the early numbers for February 2016 for market absorption by price range. This is the amount of time it will take all of the homes to sell if no further homes are added to the inventory at current rate of sale. We are finding the market is picking up, however more new listings are also coming in.
How long will it take my home to sell.
December 2, 2015
Here is a look a the sales in Chestermere November 2015 broken down by price range.
The most active price range was in the $400,000 to $600,000 range,with 60% of the homes selling in this price range. Of 123 home listed 33 sold and an additional 5 were report as under contract at the end of the month. It is a buyer’s market in Chestermere as it is in the Calgary region.
November 15, 2015
The real estate market has slowed down. This chart shows that sales in August, September and October are less than previous months. This is not unusual when there is an election. But it also appears that there are concerns about the economy. For buyers it means that you have more time to decide. However there are still multiple offers within days for the right property.
July to September Absorbtion Rates. October 20, 2015
Market slows down in third quarter. All in all the market in Chestermere is not too bad until you get over the $699k range with an absorbtion rate of many months for over this range. No homes have sold over the $800,000 range in this period as reported on the MLS system. All price ranges are taking longer to sell and the inventory is increasing, which is good news if you are a buyer. Sellers will have to keep their expectations in check, Hopefully now that the election is over the buyers will realize that they still need to buy a home.
June 2015 Market Statistics for Chestermere Area.
When you compare June to May of 2015, we can see an improvement in the absorbtion rate across all price ranges. The hottest price range is the $400,000 range with average days of 39 on market and three months of inventory. Similar to the Calgary region in general the over $1,000,000 range has a lot more homes on the market than are selling. If you are buying in this price range you will have a wide selection of homes available. If you are selling in this range, you will have to be the best home on the market at the best price, and be patient, as the market absorbs the many homes for sale.
May 7, 2015 The Chestermere real estate market is performing well. Inventory levels are healthy right up to the $700,000 range. The provincial election has slowed down the market for the past month, so we are predicting a very busy time right until the summer slow-down in July and August.
It is a great time to upgrade, as interest rates are low, lower priced homes are selling faster than the higher priced homes, giving you an opportunity to negotiate a great deal.
We would love to help. Call Doug, Marjorie or Michelle. 403-207-1776
April 1, 2015
Absorbtion Rates for 2015 First Quarter in Chestermere.
From January 1st to March 31, 1015 58 listings have sold. Currently there are 214 unsold listings on the Calgary Real Estate Boards MLS system. Broken down into price range this chart will show you how many months it will take to sell current inventory if no new homes are added.
Average price per sq. ft. over the past year in Chestermere.
How Long Will It Take My Chestermere Home To Sell? November 2014
The statistics below show how many homes are on the market and how many have sold in the past 90 days. This tells us how long it will take the market to absorb the homes currently listed. Right now it is an excellent time to sell your home under the $600,000 range. In general there is less than 2 months worth of inventory and homes are selling in under 66 days.
It is also an excellent time to upgrade your Chestermere home!
Homes over the $600,000 range in Chestermere have a much longer absorbtion rate and will experience a longer time on the market. Which means that if these people want to move they may be more negotiable on their price.
As your Chestermere real estate office we know the market. Call us if you would like help buying or selling your home.
Chestermere March 2014 Market Statistics
Chestermere single family house prices hit the highest average sale price in March since 2009, according to the Calgary Real Estate Board. The number of sales is up from March 2013 from 24 to 28, and the days on market for march is actually longer at 58 days compared to 37, however for the year to date the days on market is down from 60 to 55. Sellers are able to hold a bit firmer to their price with a .25% difference between list price and sale price.
If you have been putting off a move, now is a great time to sell. Call us we would love to help you.
Chestermere February 2014 Market Statistics.
Good news for Chestermere home owners.
Chestermere average sales prices for single family homes are up 9% from last year according to the Calgary Real Estate board. Sales are up 73% and average days on market are down from 81 to 53. Call us if you would like a free, no hassle home evaluation. We have a marketing program that will help you sell your home for all that it is worth.
See the full statistics package for February 2014 Chestermere here.
Chestermere Market Reports
Chestermere Market Stats March 2016
By Marjorie and Doug McKay on Tuesday, April 5th, 2016 in Chestermere living, Info Articles, News. No Comments
The Chestermere Market Stats for March 2016 include information on how many properties were listed, how many sold, how many were terminated, expired or withdrawn.
The average sale price for the first quarter in Chestermere was $484,029, the average days on market were 62 days. The average list price in Chestermere right now is $639,000. Homes below $500,000 are selling well considering the market we are in. In the past 3 months 52 homes were sold. 70 listings came off of the market, and there are currently 182 homes for sale in Chestermere.
The Market Absorption stats show how long it would take for the market to absorb all of the homes that are currently listed with the current rate of sales. There is no question, it is taking longer for homes to sell, and the more expensive the home the longer it will take to sell. The difference in the average sale price and the average list price shows that more people are looking In the lower price ranges.
It is a good time to move up and buy a better home as the moderately priced homes are selling much better than the estate homes. Call us if you would like our help making this move!
Chestermere real estate statistics for Marh 2016
Chestermere Absorbtion rates March 2016
These are the early numbers for February 2016 for market absorption by price range. This is the amount of time it will take all of the homes to sell if no further homes are added to the inventory at current rate of sale. We are finding the market is picking up, however more new listings are also coming in.
How long will it take my home to sell.
December 2, 2015
Here is a look a the sales in Chestermere November 2015 broken down by price range.
The most active price range was in the $400,000 to $600,000 range,with 60% of the homes selling in this price range. Of 123 home listed 33 sold and an additional 5 were report as under contract at the end of the month. It is a buyer’s market in Chestermere as it is in the Calgary region.
November 15, 2015
The real estate market has slowed down. This chart shows that sales in August, September and October are less than previous months. This is not unusual when there is an election. But it also appears that there are concerns about the economy. For buyers it means that you have more time to decide. However there are still multiple offers within days for the right property.
July to September Absorbtion Rates. October 20, 2015
Market slows down in third quarter. All in all the market in Chestermere is not too bad until you get over the $699k range with an absorbtion rate of many months for over this range. No homes have sold over the $800,000 range in this period as reported on the MLS system. All price ranges are taking longer to sell and the inventory is increasing, which is good news if you are a buyer. Sellers will have to keep their expectations in check, Hopefully now that the election is over the buyers will realize that they still need to buy a home.
June 2015 Market Statistics for Chestermere Area.
When you compare June to May of 2015, we can see an improvement in the absorbtion rate across all price ranges. The hottest price range is the $400,000 range with average days of 39 on market and three months of inventory. Similar to the Calgary region in general the over $1,000,000 range has a lot more homes on the market than are selling. If you are buying in this price range you will have a wide selection of homes available. If you are selling in this range, you will have to be the best home on the market at the best price, and be patient, as the market absorbs the many homes for sale.
May 7, 2015 The Chestermere real estate market is performing well. Inventory levels are healthy right up to the $700,000 range. The provincial election has slowed down the market for the past month, so we are predicting a very busy time right until the summer slow-down in July and August.
It is a great time to upgrade, as interest rates are low, lower priced homes are selling faster than the higher priced homes, giving you an opportunity to negotiate a great deal.
We would love to help. Call Doug, Marjorie or Michelle. 403-207-1776
April 1, 2015
Absorbtion Rates for 2015 First Quarter in Chestermere.
From January 1st to March 31, 1015 58 listings have sold. Currently there are 214 unsold listings on the Calgary Real Estate Boards MLS system. Broken down into price range this chart will show you how many months it will take to sell current inventory if no new homes are added.
Average price per sq. ft. over the past year in Chestermere.
How Long Will It Take My Chestermere Home To Sell? November 2014
The statistics below show how many homes are on the market and how many have sold in the past 90 days. This tells us how long it will take the market to absorb the homes currently listed. Right now it is an excellent time to sell your home under the $600,000 range. In general there is less than 2 months worth of inventory and homes are selling in under 66 days.
It is also an excellent time to upgrade your Chestermere home!
Homes over the $600,000 range in Chestermere have a much longer absorbtion rate and will experience a longer time on the market. Which means that if these people want to move they may be more negotiable on their price.
As your Chestermere real estate office we know the market. Call us if you would like help buying or selling your home.
Chestermere March 2014 Market Statistics
Chestermere single family house prices hit the highest average sale price in March since 2009, according to the Calgary Real Estate Board. The number of sales is up from March 2013 from 24 to 28, and the days on market for march is actually longer at 58 days compared to 37, however for the year to date the days on market is down from 60 to 55. Sellers are able to hold a bit firmer to their price with a .25% difference between list price and sale price.
If you have been putting off a move, now is a great time to sell. Call us we would love to help you.
Chestermere February 2014 Market Statistics.
Good news for Chestermere home owners.
Chestermere average sales prices for single family homes are up 9% from last year according to the Calgary Real Estate board. Sales are up 73% and average days on market are down from 81 to 53. Call us if you would like a free, no hassle home evaluation. We have a marketing program that will help you sell your home for all that it is worth.
See the full statistics package for February 2014 Chestermere here.